
Introduction
This need for speed is why a key feature of growth hacking is to experiment at the fastest possible tempo.
- As Facebook’s vice president of growth Alex Schultz puts it: “If you’re pushing code once every two weeks and your competitor is pushing code every week, just after two months that competitor will have done 10 times as many tests as you. That competitor will have learned 10 times, an order of magnitude more about their product [than you].”
69.8 million Internet users in the US (up 34 percent year over year), including nearly two out of three millennials, report using ad blocking software.
A recent McKinsey study of publicly traded software companies showed absolutely no correlation between marketing investment and growth rates. Zero. (24)
Part 1: the method
Chapter 1: Building Growth teams
The who:
- The marketing group of BitTorrent to hire a dedicated product marketing manager (PMM) to help stoke acquisitions
- The PMM works with the product team on driving growth throughout the rest of the funnel (including user retention and monetization strategies) rather than being restricted to just efforts at the very top of the funnel.
- In every case, a growth team needs a leader, who is like a battalion commander, with her boots on the ground, both managing the team and participating actively in the idea generation and experimentation process.
- Growth teams should bring together staff who have a deep understanding of the strategy and business goals, those with the expertise to conduct data analysis, and those with the engineering chops to implement changes in the design, functionality, or marketing of the product and program experiments to test those changes.
- Growth teams consist of: Growth lead, Product manager, Software engineers, Marketing specialists, Data analysts, Product designers.
- The growth lead sets the course for experimentation as well as the tempo of experiments to be run, and monitors whether or not the team is meeting their goals.
- Growth teams should generally convene once a week, and the growth lead should run those meetings (which we’ll offer guidance on how to do shortly).
- A good product manager is the CEO of the product.
- In general product managers oversee how the product and its various features are brought to life.
- At larger companies, there may be multiple levels of staff within product management, from product manager, director of product management, VP of product management, or chief product officer.
- Software engineers should be part of the ideation process.
The HOW:
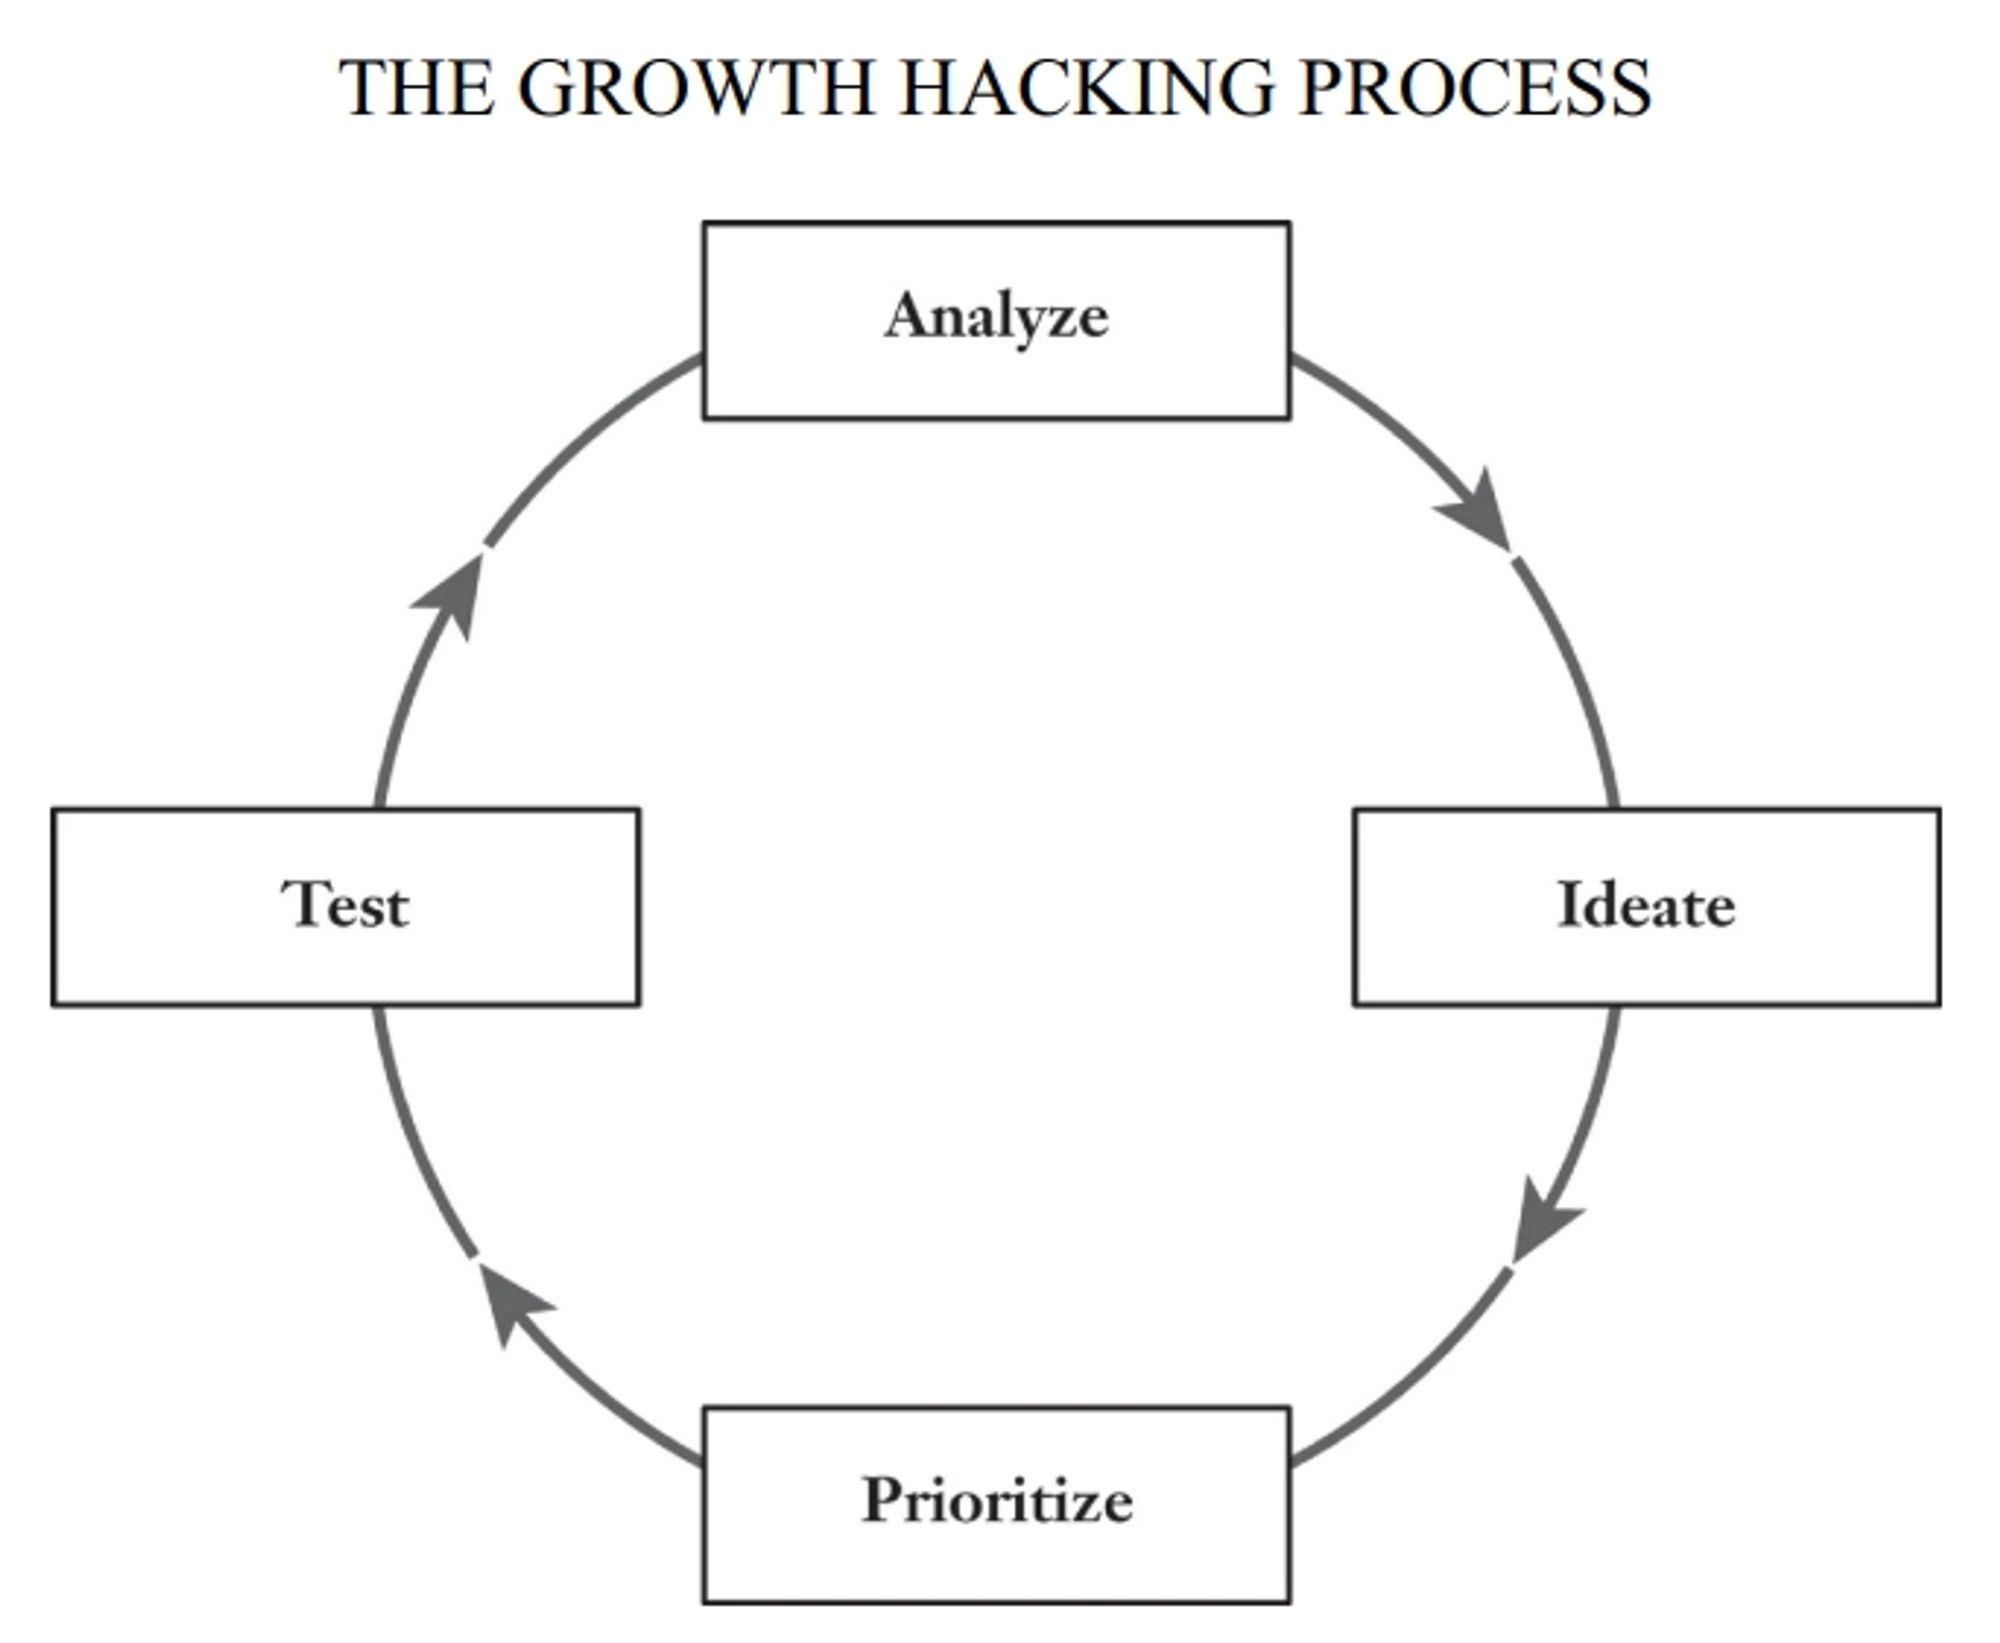
The process is a continuous cycle comprising four key steps: (1) data analysis and insight gathering; (2) idea generation; (3) experiment prioritization; and (4) running the experiments, and then circles back to the analyze step to review results and decide the next steps.
WHO DOES WHAT:
Close collaboration among all team members, such as the creation of a new product feature, which should involve cross-functional agreement about how it will be designed and implemented, how it will be messaged or delivered to customers, and how its success will be measured.
EXECUTIVE SPONSORSHIP REQUIRED:
- Growth teams must be worked into the organizational reporting structure of a company with total clarity about to whom the growth lead reports.
- It is imperative that a high-level executive is given responsibility for the team, in order to assure that the team has the authority to cross the bounds of the established departmental responsibilities.
- Growth cannot be a side project.
- At start-ups, if the founder or CEO isn’t personally leading the growth efforts directly, then the team or teams should report directly to him or her.
- Mike Schroepfer, Facebook’s CTO, told Fast Company: “I have one hand in the day-to-day and one hand in the future. It’s a little bit crazy-making at times, but it’s important that our core business continues to do well. Because that is what allows us to aggressively invest in these longer-term things.”
- Rascoff ( CEO of Zillow) has rallied the whole company around the growth mission by establishing a focus for growth efforts that he calls Zillow’s “Play,” a recurring nine-to-twelve-month growth initiative that the entire company aligns around.
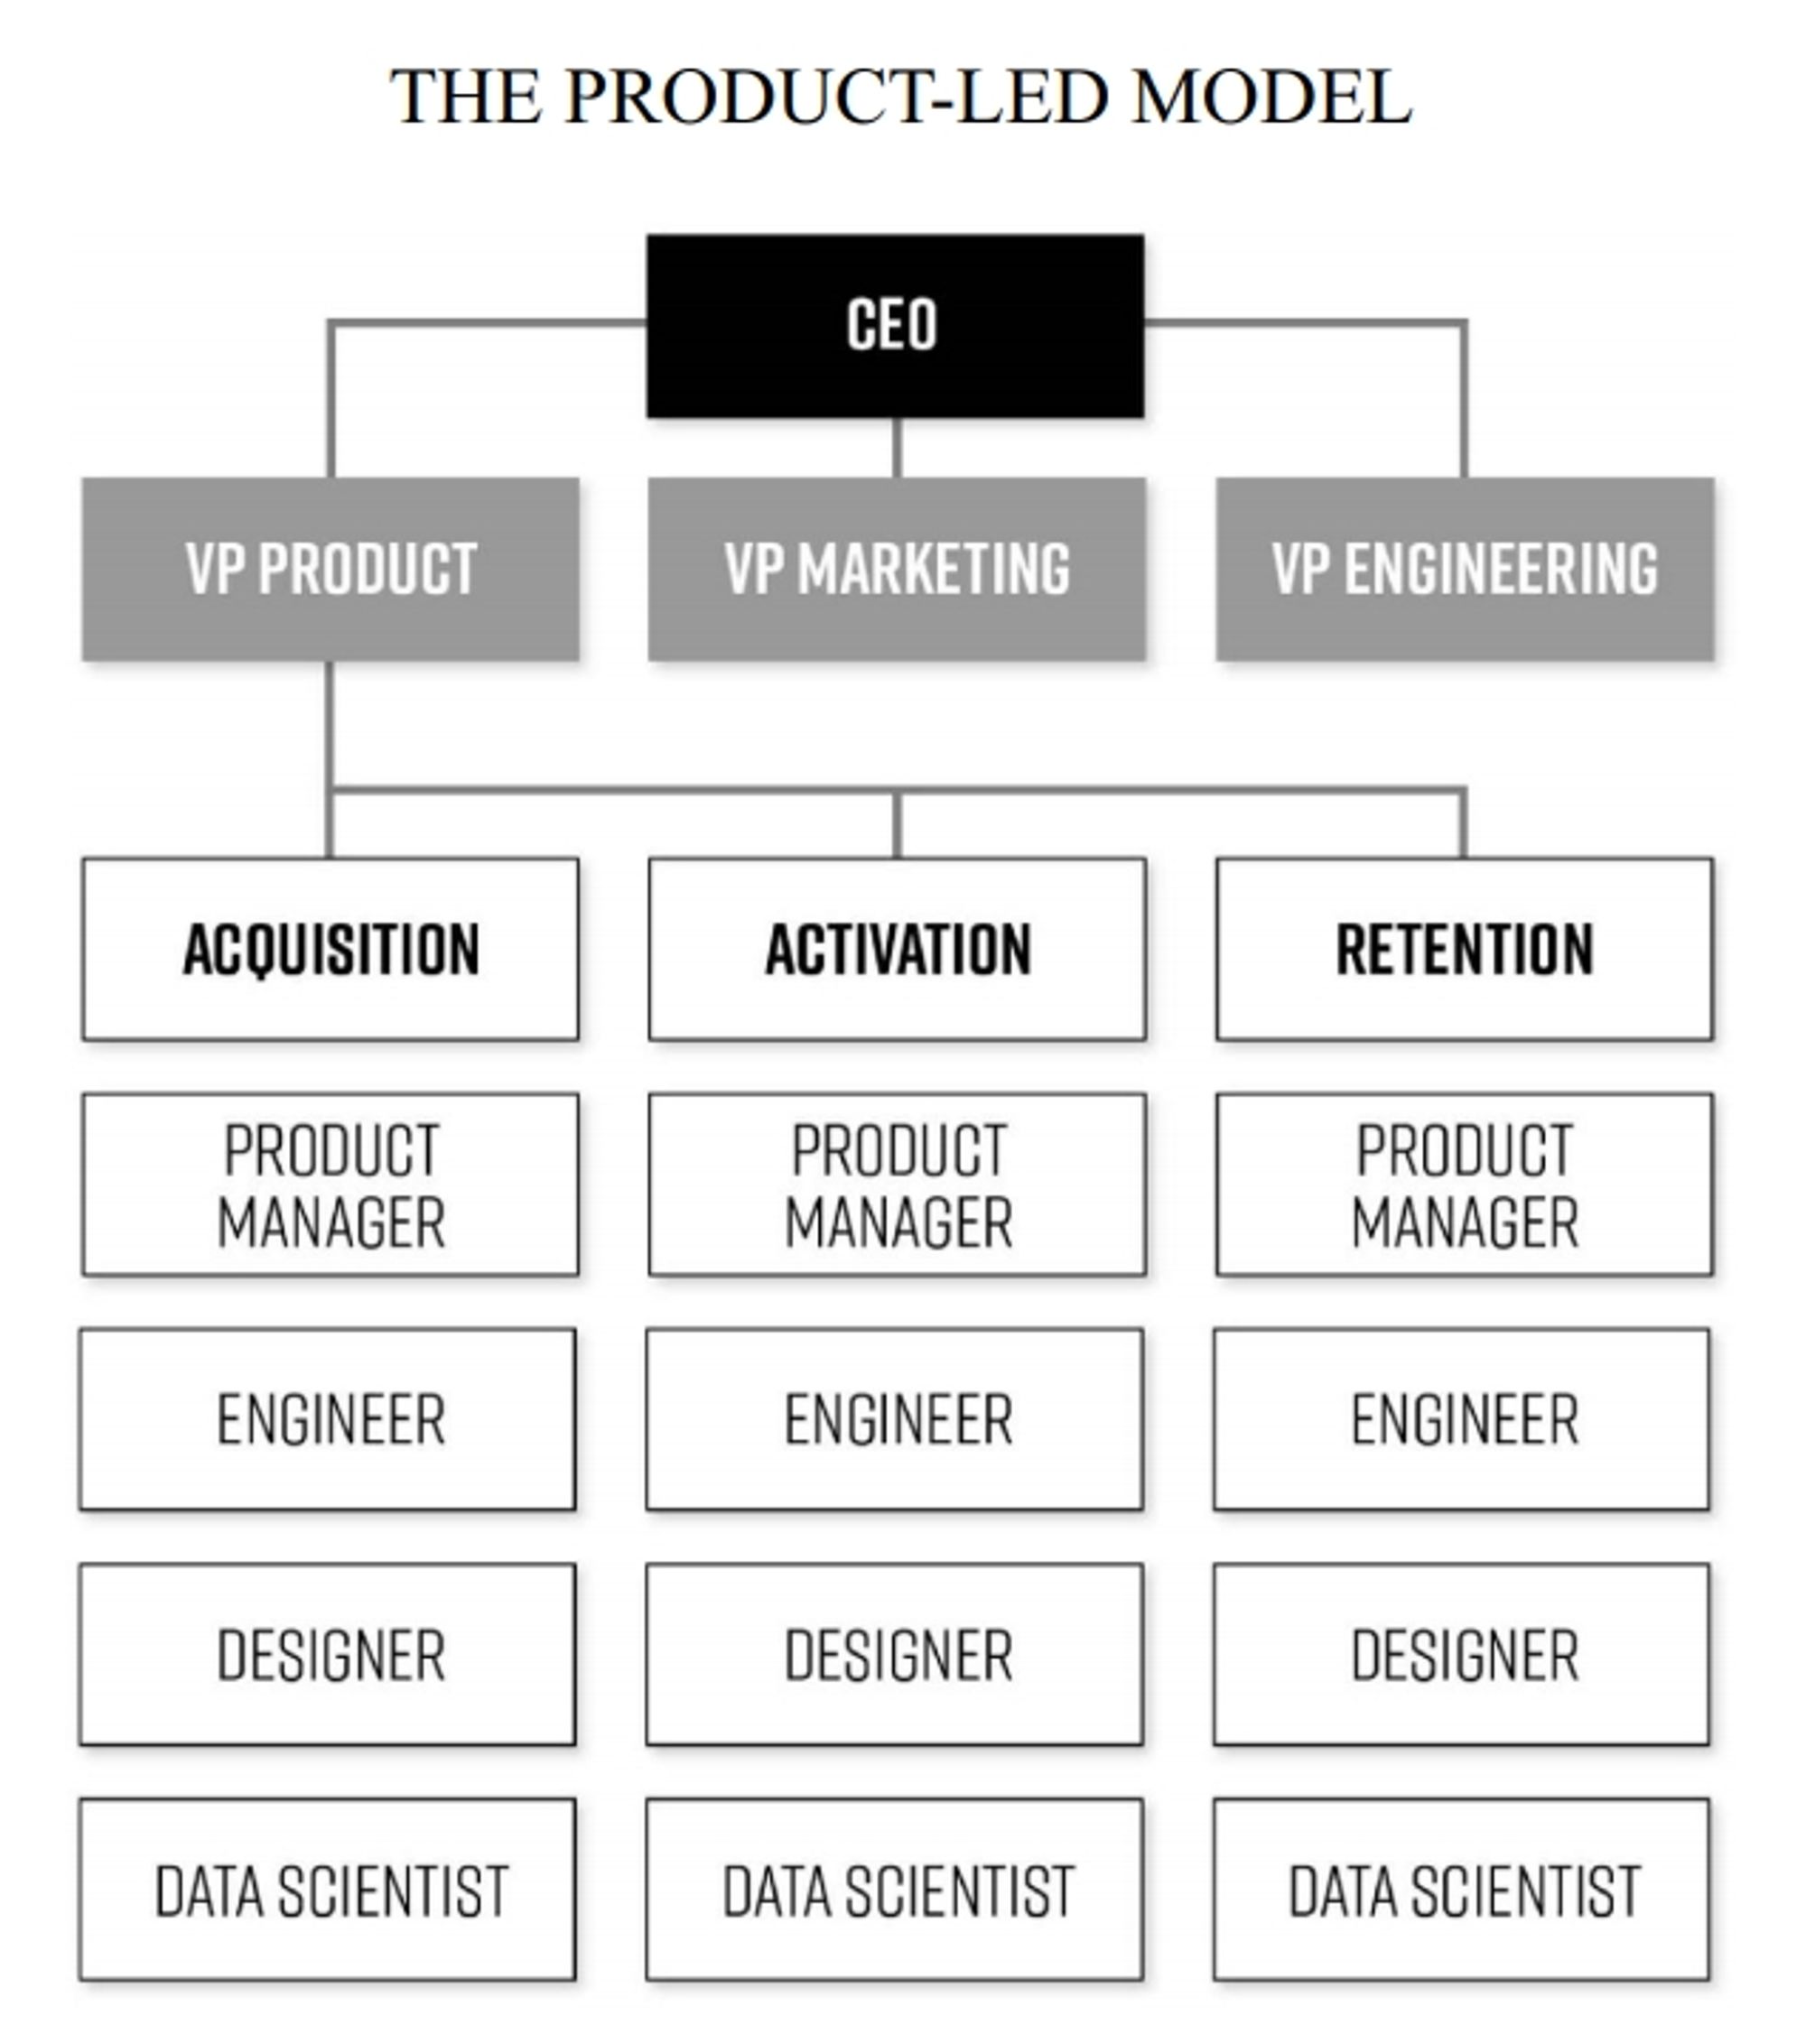
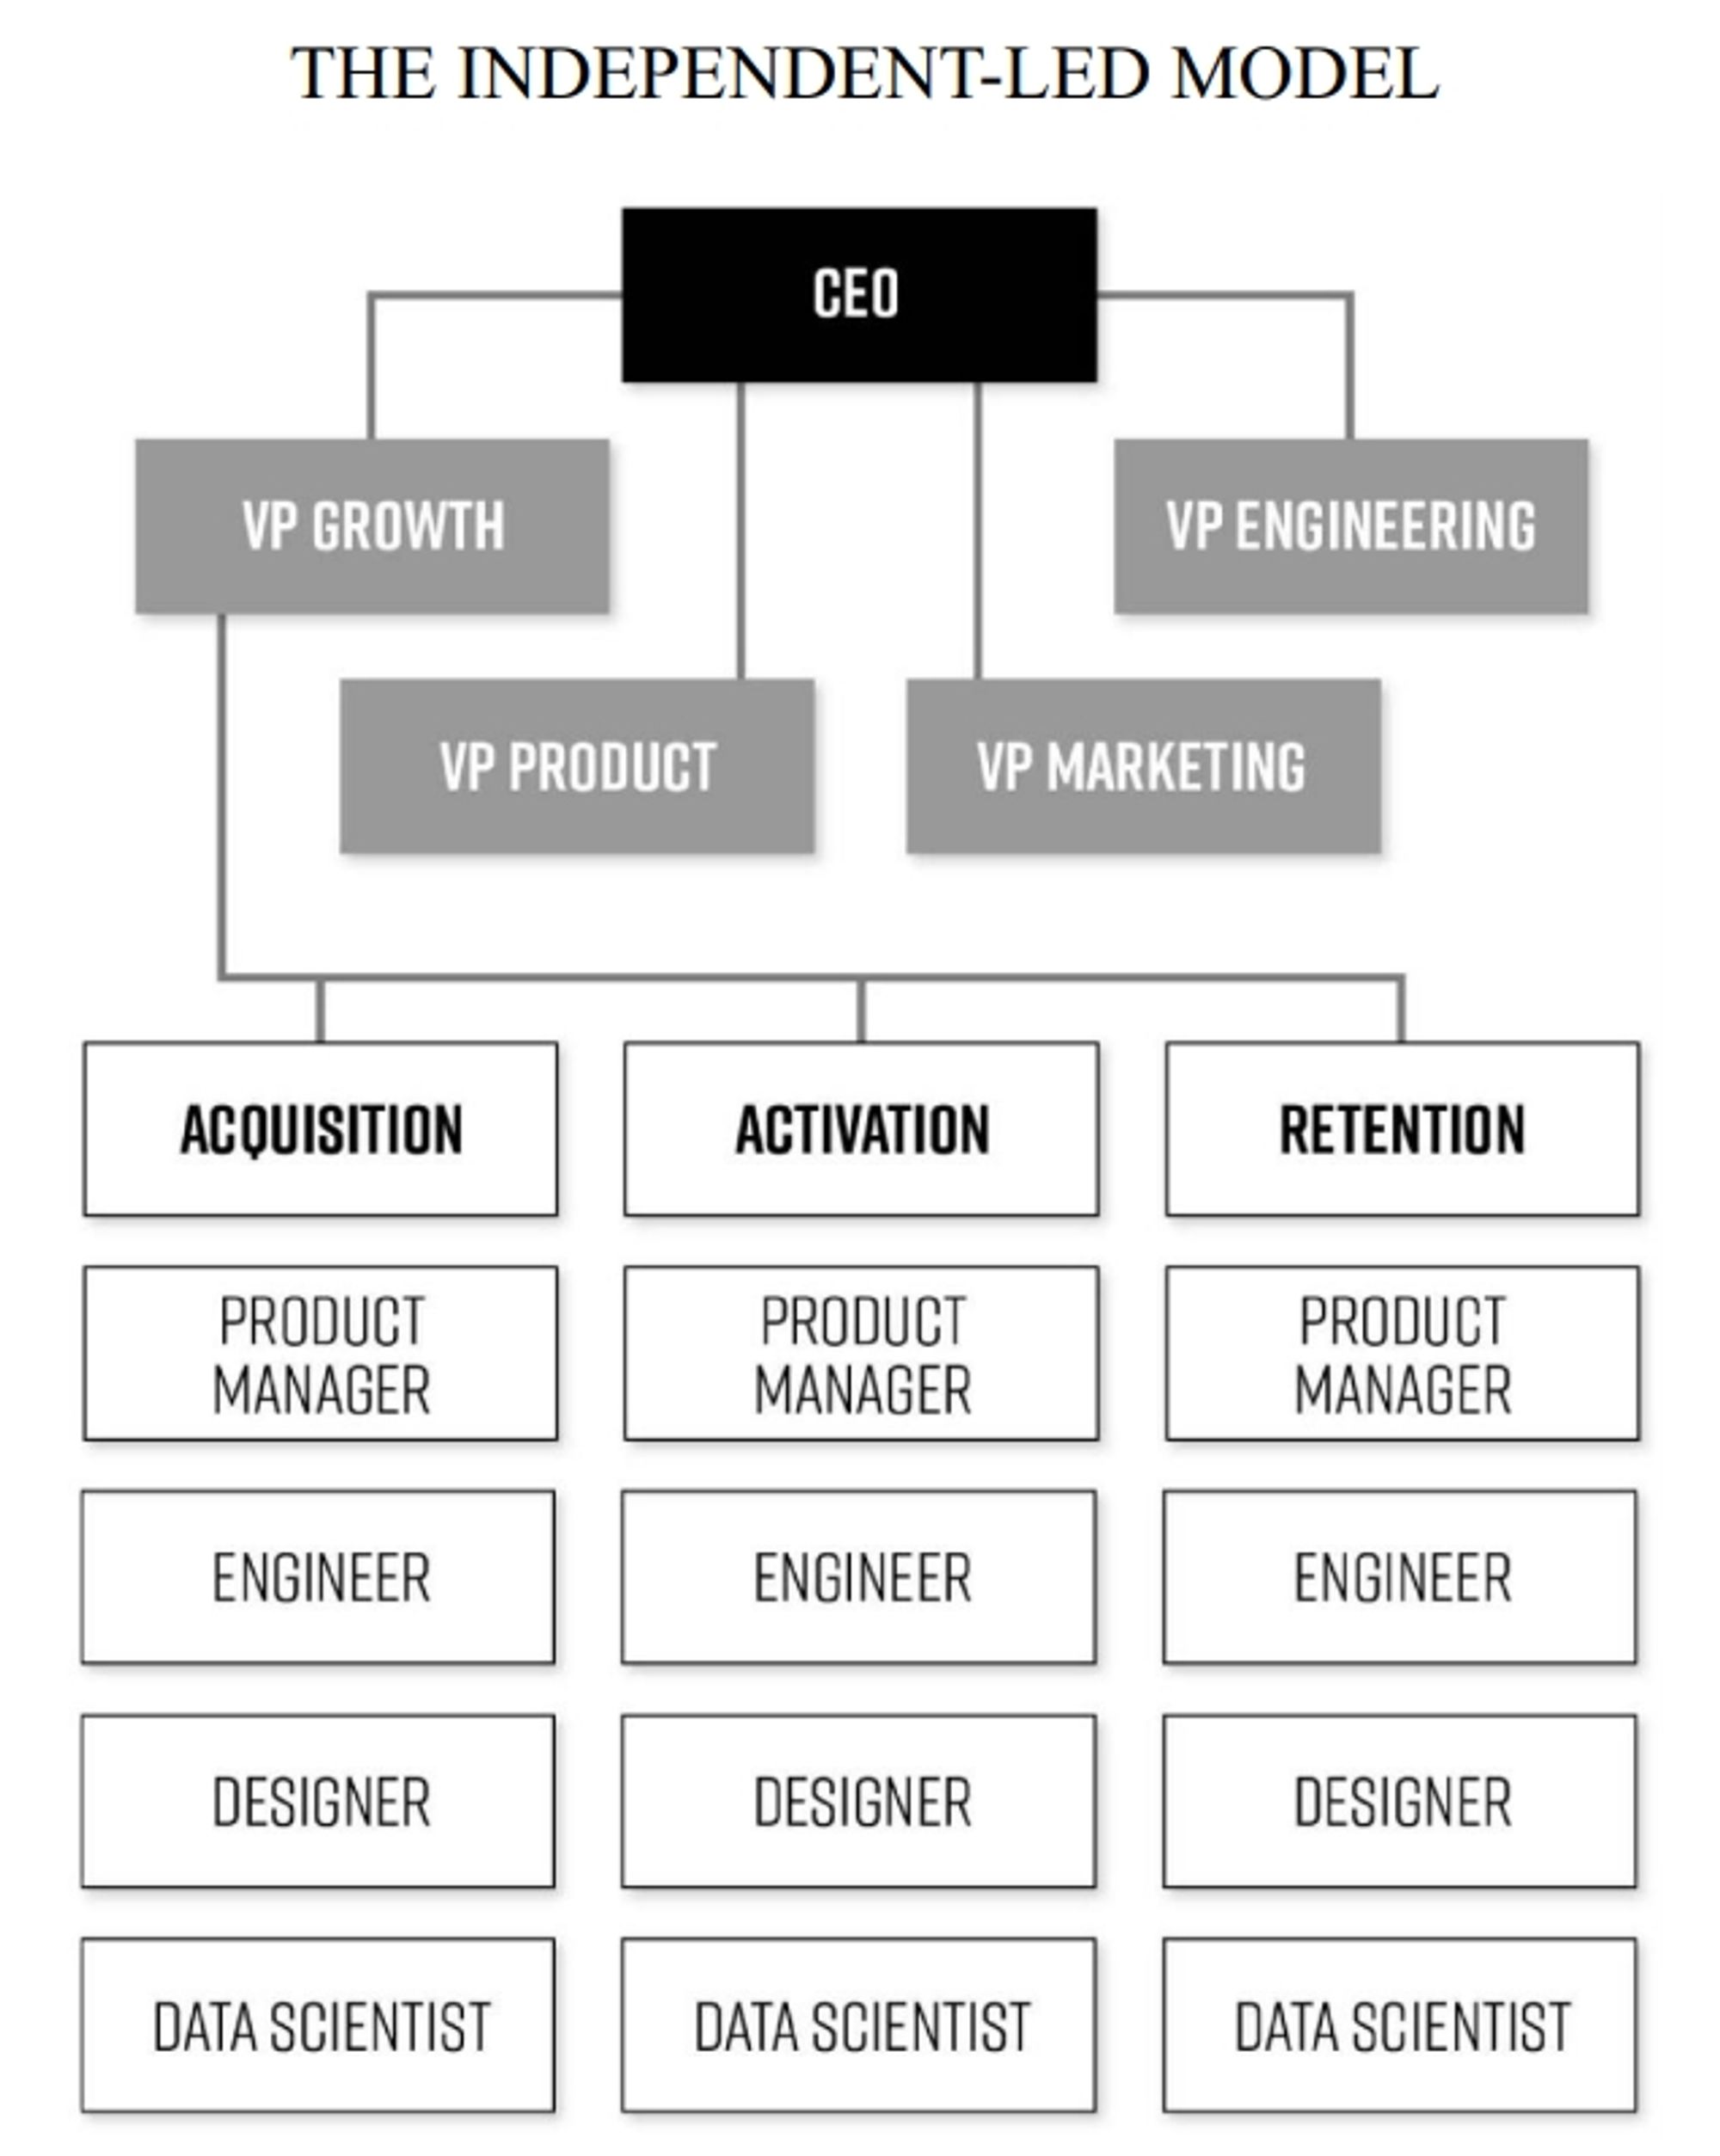
THE REPORTING STRUCTURES FOR TEAMS :
There are two common reporting structures for growth teams: THE PRODUCT-LED MODEL and THE INDEPENDENT-LED MODEL.
MELDING MINDS AND DISMISSING LORE:
- It’s not unusual for someone setting up a growth team for the first time within a company to encounter some initial resistance.
- Setting up a growth team, or set of teams, will involve either a significant realignment of personnel and reporting structures or a rededication of some of people’s time and shifting of their responsibilities, either in an ongoing capacity or for the duration of a specific growth mission.
- Growth teams can ease these tensions if they are managed correctly and if the whole team is incentivized, and rewarded, for achieving shared goals that create meaningful results for the company.
- Many growth team members have described how enthusiasm for the method built not only within their teams but all around their companies as they began to see the method working, and leading to impressive gains.
TEAMS EVOLVE:
- As companies grow and evolve, so should their growth teams.
- One cautionary note is that it’s vital not to outsource the core responsibility for growth.
- The fact is, growth is too important to delegate, and consultants often lack the organizational authority, time, or intrinsic motivation to get the hard work done that results in sustainable growth.
Chapter 2: Determining if your product is a must-have
- All fast-growth companies share one thing in common. Regardless of who their customers are, their business model, and the type of product, industry, or region of the globe they’re operating in, they all make a product that a large group of people love. They’ve built products that, in the eyes of their customers, are simply must-have.
- Creating a must-have product alone is not sufficient for breakout success, it is the baseline requirement for rapid and sustainable growth.
- building a must-have product isn’t easy, and one result is that too often those launching new businesses or products put the cart before the horse, pouring resources and staff into trying to drive more customers to a product that isn’t actually loved, or sometimes even understood, by its target market.
- One of the cardinal rules of growth hacking is that you must not move into the high-tempo growth experimentation push until you know your product is must-have, why it’s must-have, and to whom it is a must-have: in other words, what is its core value, to which customers, and why (The exception to this rule being businesses such as social networks, where the core value is the people on the platform.).
- The hard truth is that no amount of marketing and advertising—no matter how clever—can make people love a substandard product.
- Remember that viral word of mouth can work two ways; it can supercharge growth or it can stop it in its tracks
- It’s important to note that identifying core value does not necessarily follow directly from having created it. Often those of us building and marketing new products think we know what aspect of our product consumers will love—and often we are wrong.
- Many other products that achieved rocket-like growth by pushing too hard too soon for adoption have flamed out in similarly spectacular fashion.
- love creates growth, not the other way around. And for there to be love, there needs to be that aha moment.
WHAT’S THE AHA MOMENT?
- The Aha moment is the moment that the utility of the product really clicks for the users; when the users really get the core value—what the product is for, why they need it, and what benefit they derive from using it. Or in other words, why that product is a “must-have.”
- The Aha moment is what turns early adopters into power users and evangelists.
- For eBay, the aha moment was finding and winning one-of-akind items at auction from people all over the world. For Facebook, it was instantly seeing photos and updates from friends and family and sharing what you were up to.
THE MUST-HAVE SURVEY:
- The first step is a simple survey Sean designed, one that he has found again and again throughout his career in Silicon Valley to be a remarkably reliable means of measuring whether customers love a product or not. This Must-Have Survey begins with the question
- How disappointed would you be if this product no longer existed tomorrow? (Very disappointed, Somewhat disappointed, Not disappointed (it really isn’t that useful), N/A—I no longer use it)
- Interpreting the results is simple enough; if 40 percent or more of responses are “very disappointed,” then the product has achieved sufficient must-have status, which means the green light to move full speed ahead gunning for growth.
- If 25 to 40 percent of respondents answer “very disappointed,” then often what’s needed are tweaks either to the product or to the language used to describe the product and how to use it. If less than 25 percent answer “very disappointed,” it’s likely that either the audience you’ve attracted is the wrong fit for your product, or the product itself needs more substantial development before it’s ready for a growth push.
- In these cases, a set of additional questions on the Must-Have Survey will help to point you toward your next steps (check pages 72 and 73 from the e-book)
- Clearly, the larger the user base when you conduct the survey, the more reliable and informative the information will be. You’re looking to get at least a few hundred responses to the first question to be a reliable guide for this kind of survey.
MEASURING RETENTION:
- The second measure to use in assessing whether or not you’ve achieved must-have status is your product’s retention rate, which is simply the number of people who continue to use your product over a given time.
- The general rule of thumb for making this determination is that you want to achieve a comparatively high rate vis-à-vis your competitors and for that rate to be stable over time.
- The retention rate is simply calculated as the percentage of users who continue to use or pay for your product, generally tracked month to month. For products that are designed to be used very frequently, such as mobile apps and social networks and even visits to fast-food restaurants and convenience stores, teams may want to measure retention on a weekly, or even a daily, basis as well. The shorter time horizon helps you deduce how many users are making the use of the product a habit, making it a regular part of their lives, versus how many are only sporadically checking in.
- According to data published by mobile intelligence company Quettra, most mobile apps, for example, retain just 10 percent of their audience after one month, while the best mobile apps retain more than 60 percent of their users one month after installation.
GETTING TO MUST-HAVE:
- Sitting in an office with your smartest lieutenants and a whiteboard to hash out ideas for improvements may feel like exactly the right way to solve the problem, but trust us, that instinct is a head fake. It’s essential that you instead talk to users (on a deeper level than achieved through the aforementioned survey) to understand what the true objections and barriers are to your product’s success. If you don’t, you run the risk of investing your very limited resources and time in a costly false start, such as shipping a feature that doesn’t move the needle at all.
- In many cases, improvement comes from what you remove, not what you add on.
- There are three key methods, all of which should be employed in concert: Additional customer surveying, and Efficient experimental testing of product changes and messaging, Efficient experimental testing of product changes and messaging).
- The team should divide up responsibilities according to the specialized talents of each member of the growth team to conduct these diagnostics
GETTING OUT AND ABOUT IN THE ANALOG WORLD:
- No matter what business you’re in, you need to get out of the building to find out what your customers really want from you and your product.
- The feedback will be worthless if you’ve spent the whole time selling. You’ve got to be listening and observing, not pitching.
- Actions speak louder than words. The best practice is to take the product, or a prototype, out into “the wild” so that you can actually see exactly how prospective users respond to it.
FINDING A COMMUNITY TO SURVEY:
- These days, the variety of online platforms with which to find the core audience for your product is almost limitless, from the large social networks like Facebook and Instagram, to the Apple and Google app stores, to WordPress and Meetup groups of all shapes and sizes.
- In most cases just a couple hundred survey responses are needed in order to get a good bead on the underlying motivations behind the behaviors you uncovered in your data dive.
EFFICIENT EXPERIMENTATION:
- Decisions about what experiments to run must be made rigorously, and most growth teams have adopted the practice of a minimum viable test (MVT), the least costly experiment that can be run to adequately vet an idea. If the MVT is successful, the team will invest in a more robust follow-on test or more polished implementation of the concept.
- Sometimes what’s holding you back from achieving growth is not a matter of lack of value in the product or service itself, but rather of how you are communicating that value to existing and potential customers. To this one particularly powerful and typically inexpensive method is A/B testing.
- The language from “Sign Up for Free Trial” to “See Plans and Pricing” netted 200 percent more sign-ups.
- Optimizely and Visual Website Optimizer have built tools that make it easier and cheaper than ever for companies to set up experiments on their websites without much help from the engineering team.
- A/B testing should also go far beyond the language and design of landing pages and marketing promotions.
- Engineers can be powerful sources of ideas for additional kinds of test opportunities farther down the funnel, which tend to be more technically complicated and can often be beyond the vision of the nontechnical team members.
EXPERIMENTS WITHIN THE PRODUCT:
- Adjustments that have historically proven to improve results and enhance the user experience should be prioritized, such as speeding up the response time of a Web shopping cart or improving the sign-up process. But other, less-battle-tested changes such as substantial redesigns or building of new product features should be done only on the basis of a strong hypothesis, formed through the analysis of user research and data.
TAKING A DATA DIVE:
- What you want to create is what’s often called a data lake or data warehouse: a single location where all customer information is stored and where you can really dive in and uncover distinctive groupings of users who may be using the product differently from other groups.
WHAT ARE ACTIVE USERS DOING?
- At RJMetrics, a business intelligence company, the team found that users who edited a chart in the software during their free trial period were twice as likely to convert to paying customers as those who didn’t and that that number went up even higher when a trial user edited91 two charts. So what did RJMetrics do? They made the editing of a chart a key step in their new user orientation.
PIVOTING TO THE UNEXPECTED:
- The more you test, the more data you have to analyze, and the more data you analyze, the more patterns are bound to emerge.
- Though it is hard to believe today, YouTube started as a video dating site, pivoting to be the home for all video online only once the founders saw that users weren’t only uploading video profiles to find dates, but rather sharing videos of all types.
DRIVING TO THE AHA:
- All of this experimentation and analysis should be focused on discovering the aha moment you are offering, or can offer, customers.
- Once the conditions that create that magical experience have been identified, the growth team should turn its attention to getting more customers to experience that moment as fast as possible.
Chapter 3: Identifying your growth levers
- Even truly great products that are loved by a core group of early adopters will almost surely fail without a well-focused effort to vigorously drive growth.
- Most freemium product conversion rates is around 1%
- The Everpix tragedy demonstrates the importance of focusing not just on growth but on the right levers of growth at the right time.
HACKING YOUR GROWTH STRATEGY:
- Growth hacking is not about throwing ideas against the wall as fast as you can to see what sticks, it’s about applying rapid experimentation to find and then optimize the most promising areas of opportunity.
- In the early phase of growth, you want to craft a strategy for running the experiments that will have the greatest impact on growth in the least amount of time.
- Running lots and lots of tests of small changes, like button colors, isn’t the way to start practicing the growth hacking process. Instead, small teams must focus on those tests that promise to have the highest potential for impact first.
THE METRICS THAT MATTER:
- The fundamental growth equation (FGE) is a simple formula that represents all of the key factors that will combine to drive your growth; This equation is different for every product or business.
- Inman News's FGE: (WEBSITE TRAFFIC × EMAIL CONVERSION RATE × ACTIVE USER RATE × CONVERSION TO PAID SUBSCRIBER) + RETAINED SUBSCRIBERS + RESURRECTED SUBSCRIBERS = SUBSCRIBER REVENUE GROWTH
- eBay's FGE: NUMBER OF SELLERS LISTING ITEMS × NUMBER OF LISTED ITEMS × NUMBER OF BUYERS × NUMBER OF SUCCESSFUL TRANSACTIONS = GROSS MERCHANDISE VOLUME GROWTH
- For Facebook, the amount of items being shared by users and the time spent looking through the News Feed are key factors.
- The metrics that appear in Google’s default dashboards aren’t necessarily the most important for your growth.
- Reducing the complexity of your business operations down to a basic formula is immensely helpful in allowing the growth team to focus on the right signals in this vast sea of data noise.
- Yet for some businesses, like Facebook, for example, daily active users is a hugely important metric because (a) as you may know from experience there is virtually no (or at least an alarmingly high) limit to the number of times one can visit Facebook in a single day; and (b) its advertising-based revenue model is premised on having lots of users who spend considerable time on the site. A metric that means nothing for one company, in other words, may be another’s core growth lever.
CHOOSING A NORTH STAR
- To hone your growth equation and narrow your focus, it’s best to choose one, key metric of ultimate success that all growth activity is geared toward.
- WhatsApp’s North Star was the number of messages sent, rather than, say, daily active users, because even if a user is active with the app every day, but is only sending one message, it’s unlikely that WhatsApp is their preferred choice for communicating with their network.
- The North Star may change over time as the company grows and initial goals are achieved.
ILLUMINATING THE BEST BETS
- Facebook’s original growth team lead, Chamath Palihapitiya, wisely cautioned in one talk, “If you can’t be extremely clinical and extremely unemotionally detached from the thing that you’re building, you will make these massive mistakes and things won’t grow because you don’t understand what’s happened.”
- US World War II commander General George Patton said, “A good plan violently executed now is better than a perfect plan tomorrow.”
THE DATA IMPERATIVE
- Much as an airplane can’t fly without instruments providing information about altitude, air pressure, and wind speed constantly being monitored, without the right data at your fingertips, your growth team will be flying blind.
IT’S NOT ALL ABOUT THE NUMBERS
- Even the most sophisticated analysis can really only tell you definitively what users are doing, not why they’re behaving that way.
- Other issues that are holding people back from avidly using your product can be much more difficult to understand, and figuring out the why behind what’s going on requires conducting some user surveys or interviews, or both.
- While the practice of talking to users in the early development stage of testing a prototype has become widespread, at far too many start-ups and established companies, it falls by the wayside once the product has been launched. Continuing to tap this vital resource as you move into the high-tempo experimentation process is extremely important, as the feedback garnered leads the way to many of the most powerful experiments you can run.
DESIGN ACCESSIBLE REPORTING
- After all, even if you’ve looked at all the right metrics and crunched all the right numbers, if no one on the team (outside of the data analysts) can understand your findings, they are unlikely to result in meaningful action.
- We are huge fans of dashboards because (a) they help focus team members’ attention on key trends or metrics; and (b) they allow you to share findings with the whole company, which encourages more participation in the growth effort.
- For one, metrics should be presented as ratios rather than static numbers. For example, reporting on the total number of users acquired is static and tells you little, but new users acquired per day or week is much better, because it can be compared with previous time periods to see if the rate is rising or falling.
PUTTING IT ALL TOGETHER
- Cohort analysis is dividing your customers or users into distinctive groups by a common trait. For Twitter, a basic division of users might be by the month they joined the service. This can be determined fairly effortlessly, but with a large and detailed data cache, you’d be able to create much more refined cohorts, such as people who look at Twitter up to five times a day but never tweet, people who tweet only on weekends, people who add ten or more new followers a week, and so forth.
- By actually picking up the phone and calling people, the team can learn exactly what is going on
Chapter 4: testing at high tempo
- Remember that, generally, big successes in growth hacking come from a series of small wins, compounded over time.
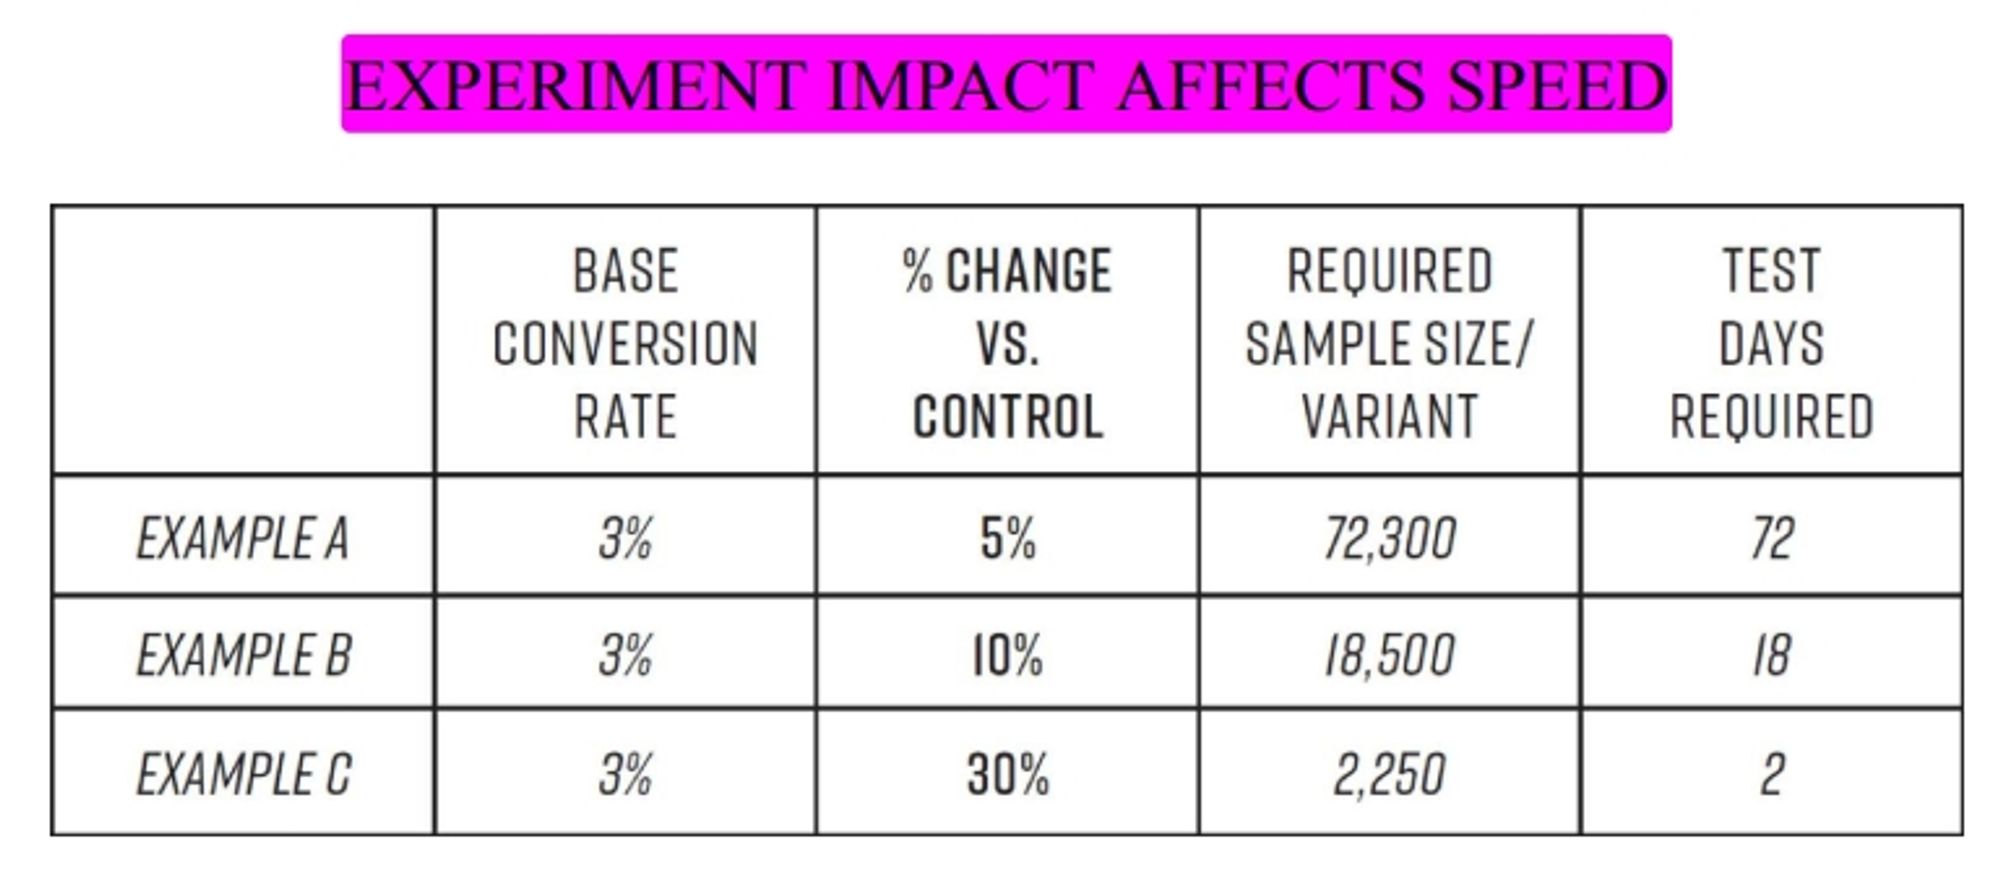
- Peep Laja, a renowned expert in conversion rate optimization—the science of getting more visitors to a website or app to become customers—loves to point out that a 5 percent improvement in conversion rate every month nets an 80 percent improvement in a year due to the compounding nature of wins.
TEMPO PICKS UP OVER TIME
- Many of the leading growth teams regularly run 20 to 30 experiments a week, and some run many more.
- We advise that teams start slow and build to a faster tempo after the team gets its footing with the new process; trying to launch too many experiments right off the bat can lead to poor test implementation, team confusion, and discouragement as targets are missed. Running careless or poorly designed tests can do more harm than good. Just as you shouldn’t try to run a triathlon without proper training and warm-up, neither should you jump into the growth hacking process at breakneck speed. That is a sure recipe for failure.
THE GROWTH HACKING CYCLE
- At GrowthHackers we use a one-week cycle. The cycle is managed by a one-hour weekly growth team meeting to review results and agree on the next week’s set of experiments to implement.
- In the very first growth meeting, you won’t yet be making decisions about which tests to run. Rather, team members will take the next week to brainstorm and percolate ideas for what experiments to run in the first cycle; these will be discussed and selected from at the next week’s growth meeting.
- Linus Pauling said, “The best way to have a good idea is to have lots of ideas.”
STAGE 1: ANALYZE
- To start probing for areas of growth opportunity, they formulate a set of questions to guide their analysis, as follows: (check page 129 from the e-book for more detailed set of questions).
STAGE 2: IDEATE
- Ideas should be submitted to an idea pipeline, following a templated format by which they should be submitted (Idea name, Idea description, Hypothesis, Metrics to be measured).
- Ideas should be submitted to an idea pipeline, following a templated format by which they should be submitted.
- Remember, the more ideas that go into your pipeline the better your chances of finding winners that spur growth.
- Asking your customers to share ideas can also be enormously enlightening, especially your most passionate users. They’re often thrilled to be asked and may have a good deal more experience with actually using your product than (sadly) your team does.
STAGE 3: PRIORITIZE
- At GrowthHackers, Sean developed the ICE score system, with ICE standing for Impact, Confidence, and Ease, as a way to organize all the ideas generated in the ideation process of the cycle.
- When submitting ideas, the submitter should rate each idea on a tenpoint scale, across each of the following three criteria: the idea’s potential impact, the submitter’s level of confidence in how effective it will be, and how easy it will be to implement.
- Example <Image 5>
- With experience and practice, you’ll soon learn how to use data, previous experiment findings, and industry benchmarks to estimate your idea’s value.
- Our own expectations for our ideas aren’t foolproof
- We recommend making experiment selection a collaborative process.
- To keep the number of ideas for discussion manageable, we limit each team member to a maximum of three test candidates for the week.
BACK TO STAGE 1: ANALYSIS AND LEARNING
- The results should be written up in a test summary. It should also be added to a database where you store all test summaries, which we call the knowledge base.
- For teams using instant messaging software (like Slack), you could consider creating a channel or chat room dedicated to the sharing of test results and discussion about them.
THE GROWTH MEETING
- 15 MINUTES: METRICS REVIEW AND UPDATE FOCUS AREA (page 146)
- 10 MINUTES: REVIEW LAST WEEK’S TESTING ACTIVITY (page 147)
- 15 MINUTES: KEY LESSONS LEARNED FROM ANALYZED EXPERIMENTS (page 147)
- 15 MINUTES: SELECT GROWTH TESTS FOR CURRENT CYCLE (page 147)
- 5 MINUTES: CHECK GROWTH OF IDEA PIPELINE
Part 2: the growth hacking playbook
Hacking acquisition
Chapter 5: the hacking acquisition
Introduction
- making acquisition efforts as cost effective as possible is always good business, and all companies should always be striving to spark strong word of mouth in order to reduce the expense of acquiring new customers.
- The first phase of work in scaling up your acquisition of customers should be devoted to achieving two additional types of fit: language/market fit, which is how well the way you describe the benefits of your product resonates with your target audience, and channel/product fit, which describes how effective the marketing channels are that you’ve selected to reach your intended audience with your product, such as paid search advertising or viral, or content, marketing. In this chapter we’ll show you how to use the growth hack
CRAFTING A COMPELLING MESSAGE
- With so little time to impress people, it is imperative that they understand almost immediately how your product can benefit them.
- The human response to language is highly emotional, and largely subconscious.
- Writing marketing copy is not an exact science. This is why growth hacking is designed to bring the rigor of scientific experimentation to the creative process. What this means is that you don’t need to be a marketing savant like Jobs to get language/market fit right; the growth hacking process will get you there.
- Now one of the largest media sites on the Web, Upworthy grew at a lightning-fast clip, thanks in large part to their dedication to seeking language/market fit for every story they publish—their genius is in repackaging content they find on the Web with headlines so catchy they often go immediately viral. But it’s not that Upworthy’s editors are necessarily the most naturally brilliant or creative; their brilliance is that they don’t leave creativity up to chance. Instead, they hack it. The process of selecting headlines begins with a staffer writing at least 25 different possible headlines for each story. Out of these 25, a curator chooses a handful of favorites, and then the managing editor green-lights a set of those for testing. And their testing method couldn’t be simpler. The only tools necessary are Facebook, Bitly (a free online site that generates trackable URLs for Web content), and an old-fashioned timer. Here’s how they do it.
- They pick two promising headlines for the same story and give each its own Bitly URL. Next, they segment their Facebook fans to find two cities with similar demographics and populations, such as one group of people in Minneapolis and another in Milwaukee, and they share one Bitly link with each group. Then they simply set a timer and wait, tallying the clicks and shares that roll in. When the time is up, the headline with the most clicks and reshares wins
- Adopt the language that your customers are using to describe your product and its benefits in social media posts and in online reviews.
START SMALL
- “store your photos online” vs “Share Your Photos Online.”
- The test took almost no time to implement and the results were instant and staggering. The change of one word, from “store” to “share,” completely altered users’ perceptions of what the product was and how they should use it.
- “Find a Date,” vs “Help People Find a Date,”
- The service added 29 million users within 8 months of making the single change.
LANGUAGE FIT HELPS HONE YOUR PRODUCT, NOT JUST YOUR BRANDING
FINDING CHANNEL FIT IS NOT LIKE PORTFOLIO MANAGEMENT
- Marketers commonly make the mistake of believing that diversifying efforts across a wide variety of channels is best for growth. As a result, they spread resources too thin and don’t focus enough on optimizing one or a couple of the channels likely to be most effective.
- As Peter Thiel, cofounder of PayPal, Palantir, and the first outside investor in Facebook, tells start-up founders, “It is very likely that one channel is optimal. Most businesses actually get zero distribution channels to work. Poor distribution—not product—is the number one cause of failure. If you can get even a single distribution channel to work, you have great business. If you try for several but don’t nail one, you’re finished.”
- Experimenting through the growth hacking process allows you to discover your optimal channel or two relatively quickly, ideally before your competition does.
NARROWING THE FIELD
- There are two phases in which to home in on your best channels: discovery and optimization.
THE THREE CATEGORIES OF CHANNELS
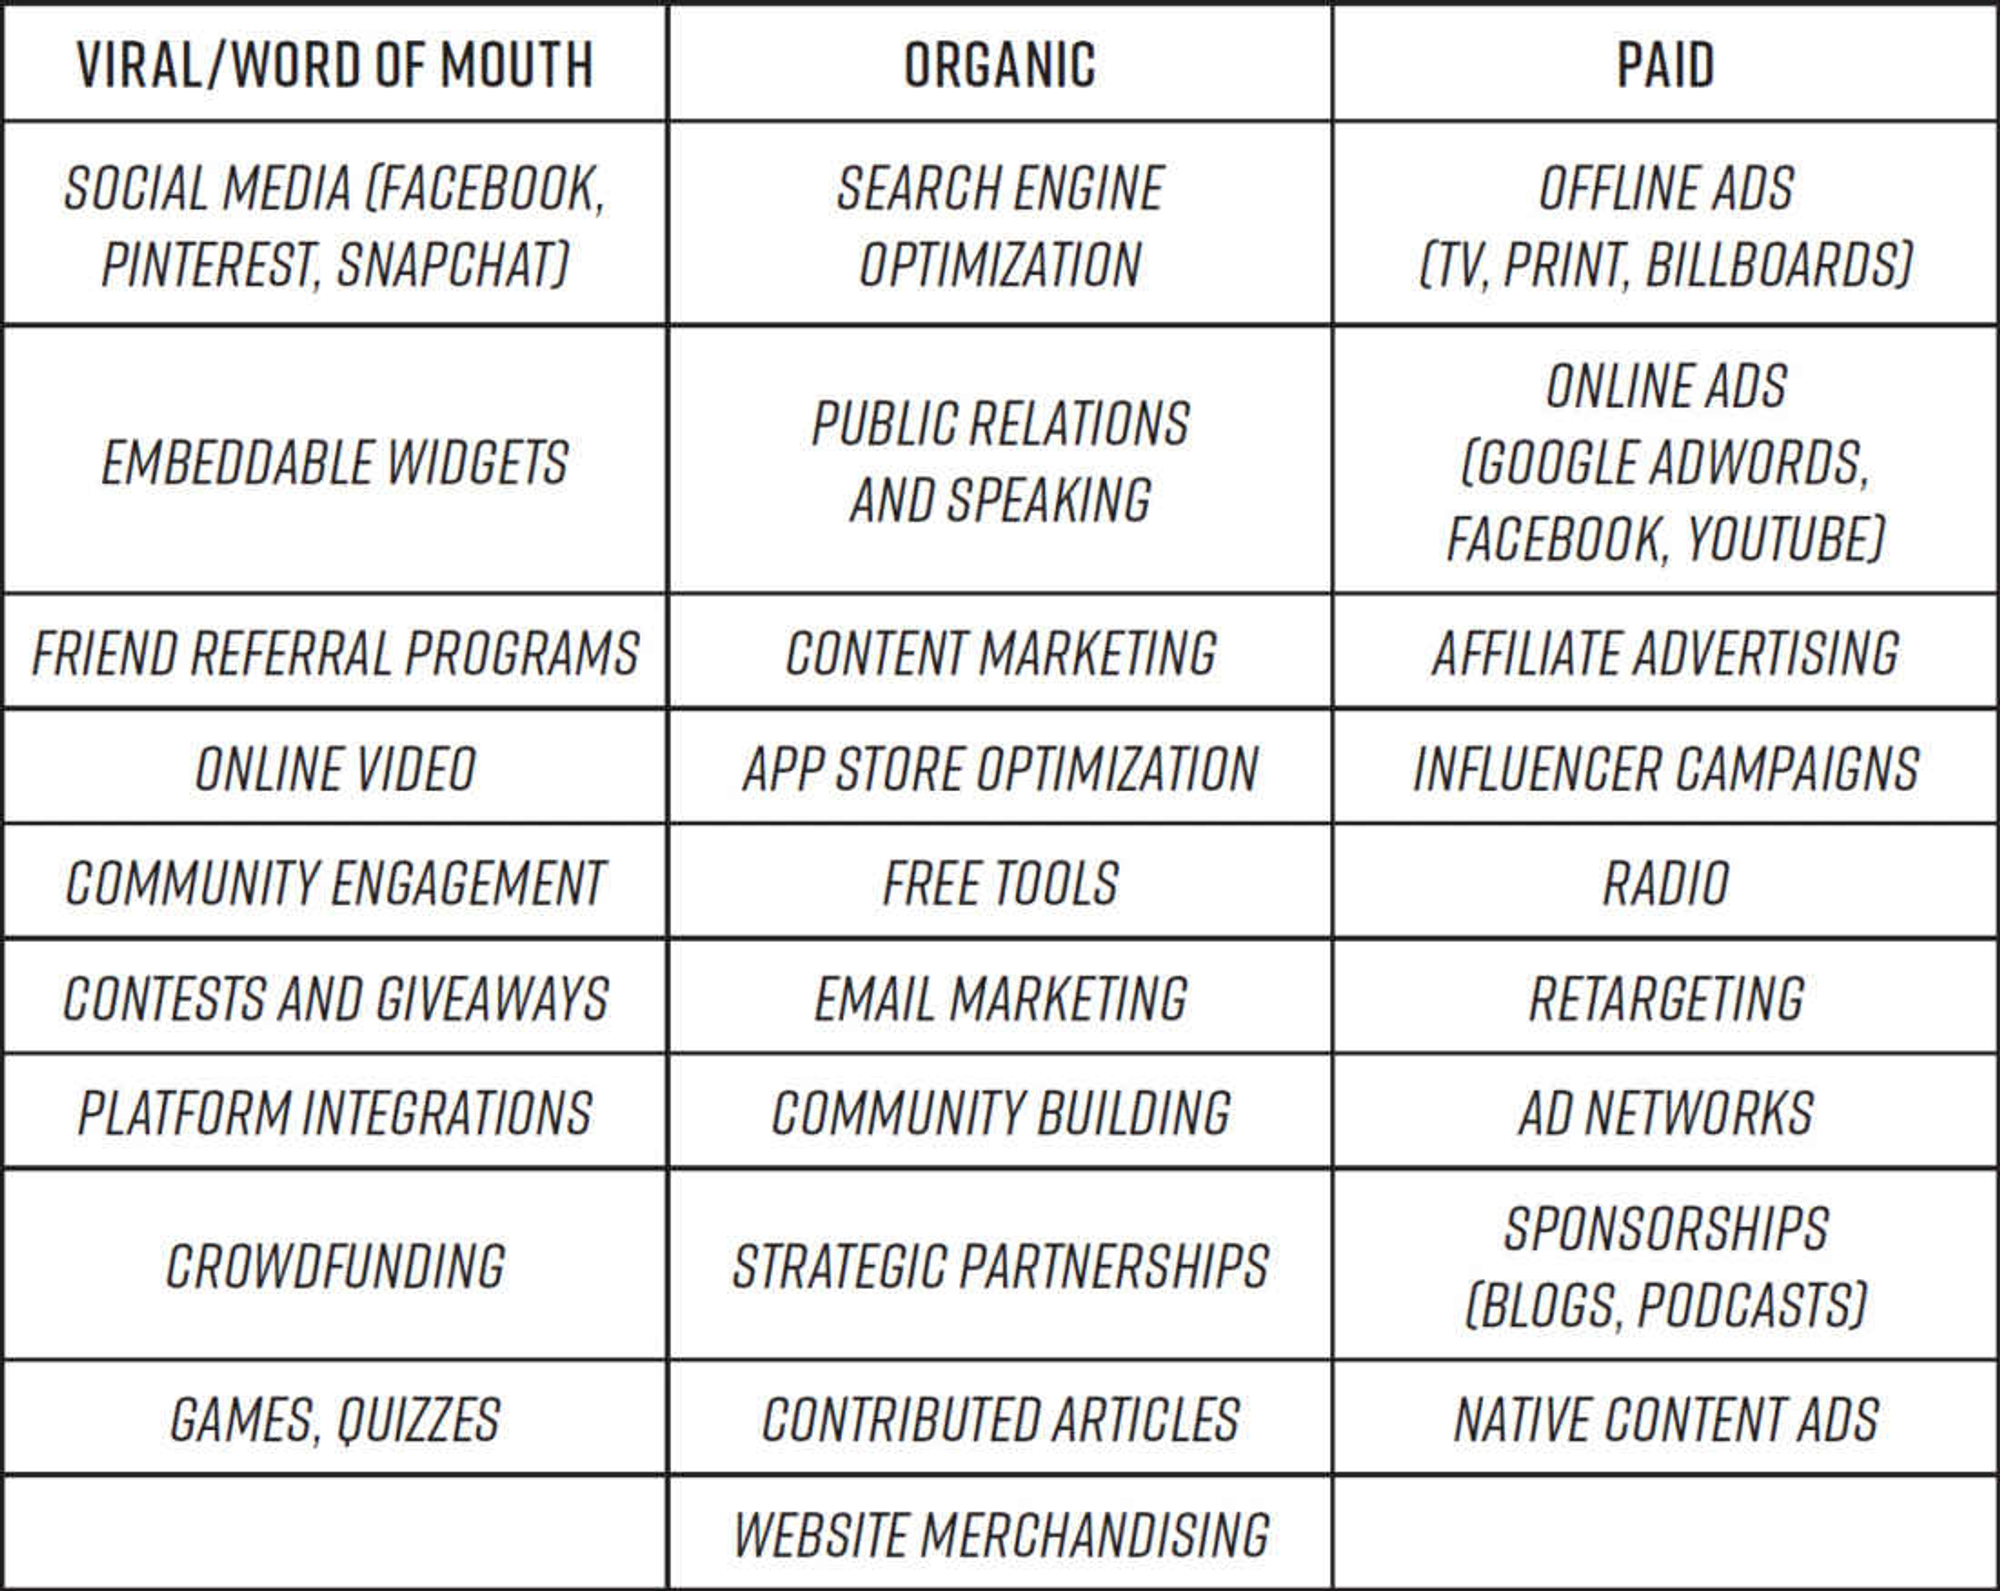
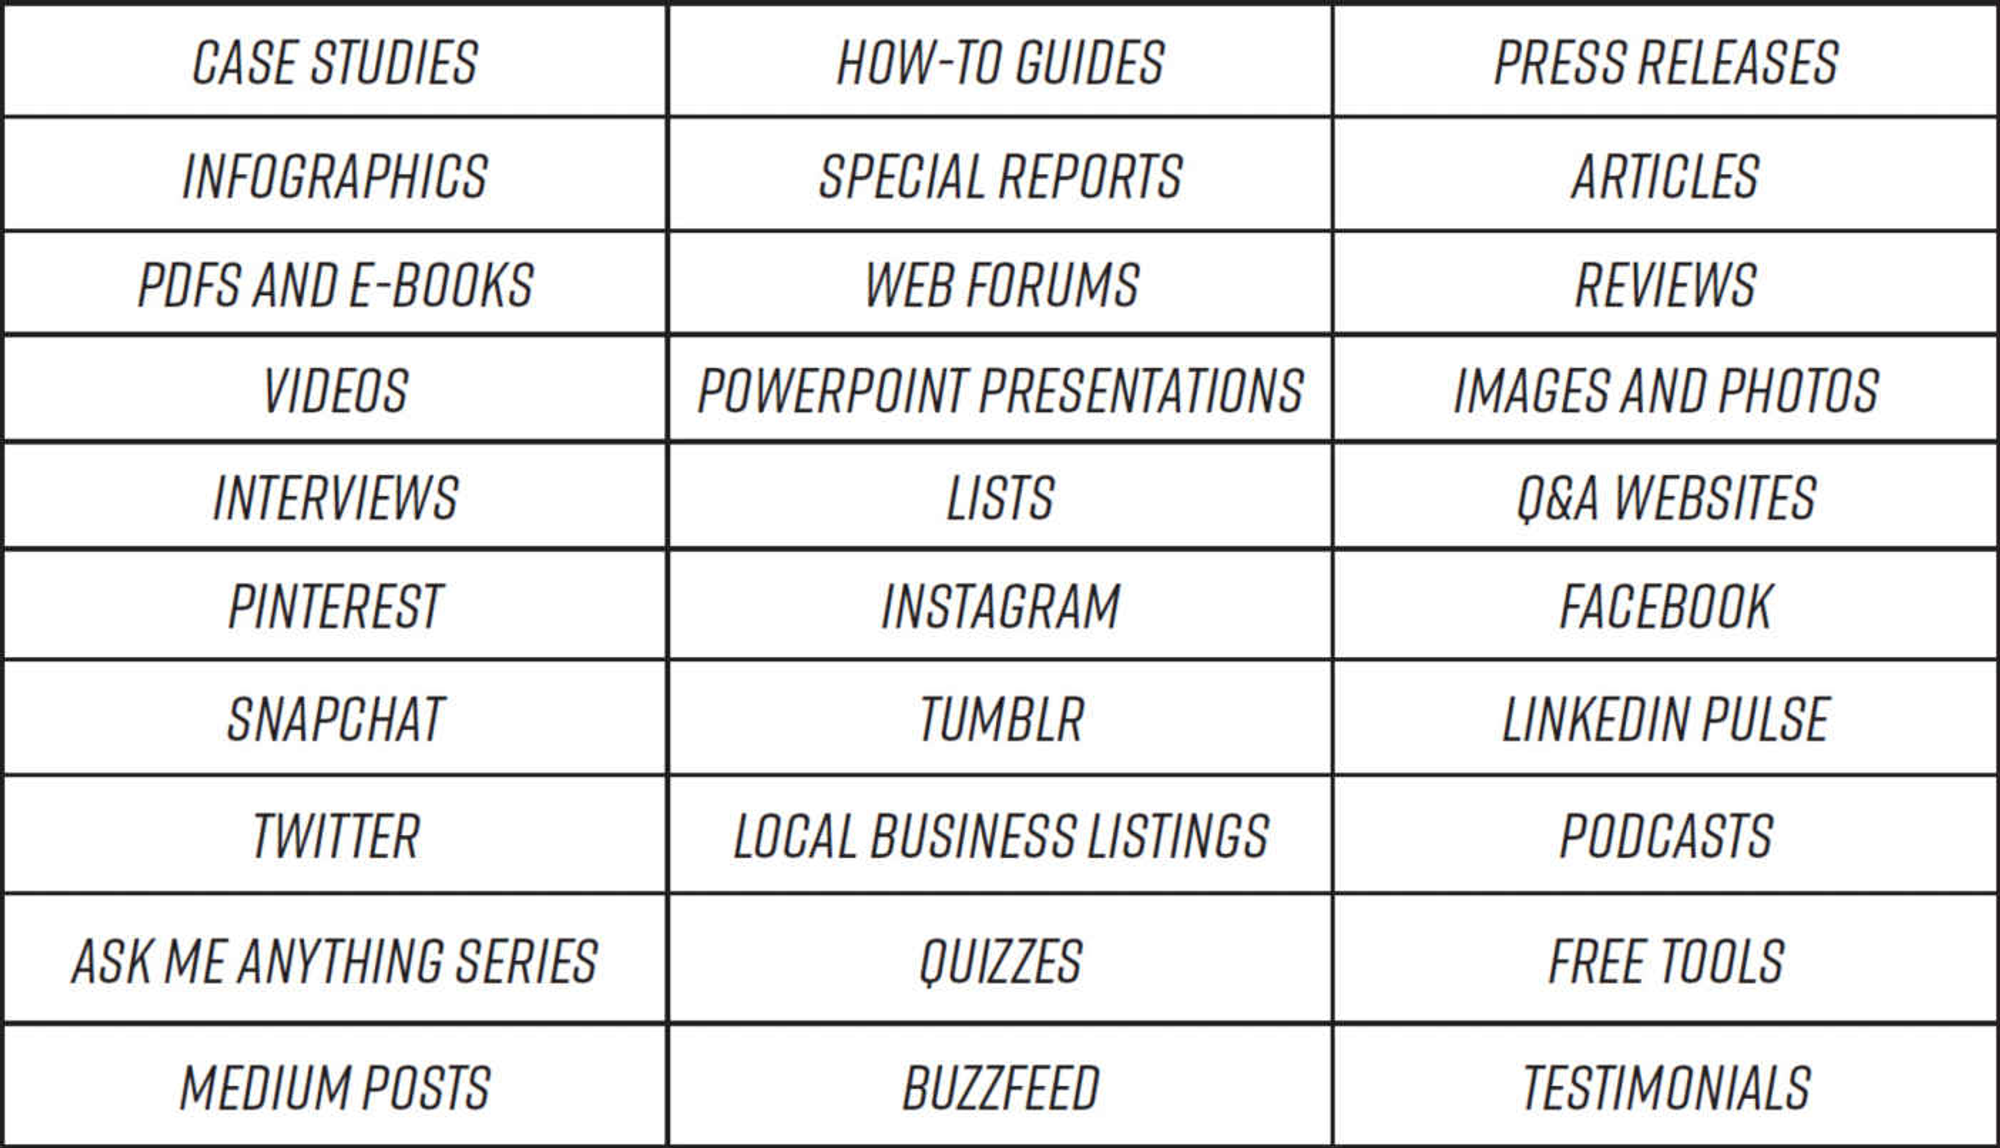
THE LEADING TYPES OF CONTENT MARKETING
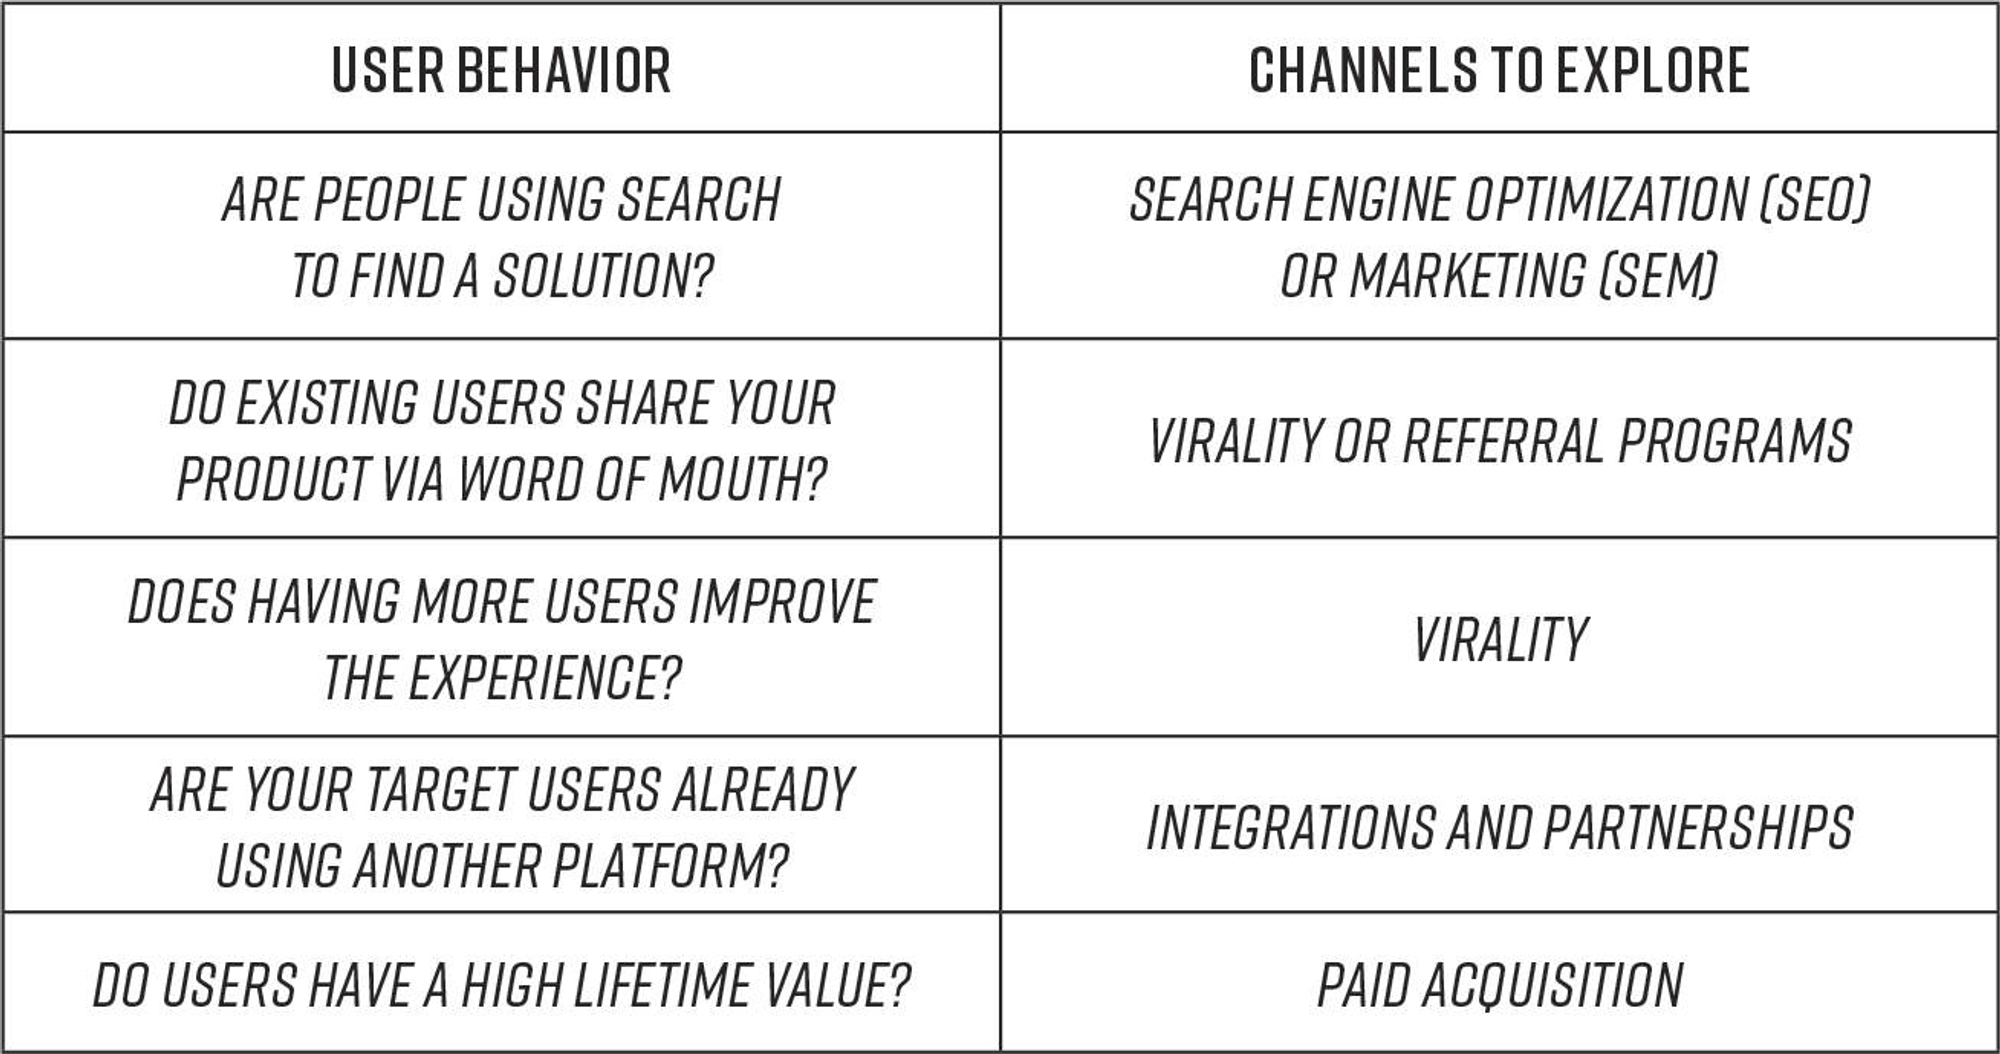
MAKING A FIRST CUT
- Aatif Awan, the Vice President of Growth & International Products at LinkedIn, who helped take the company from 100 million users to more than 400 million, created this handy chart of types of user behavior that you can use as a guide in making these decisions.
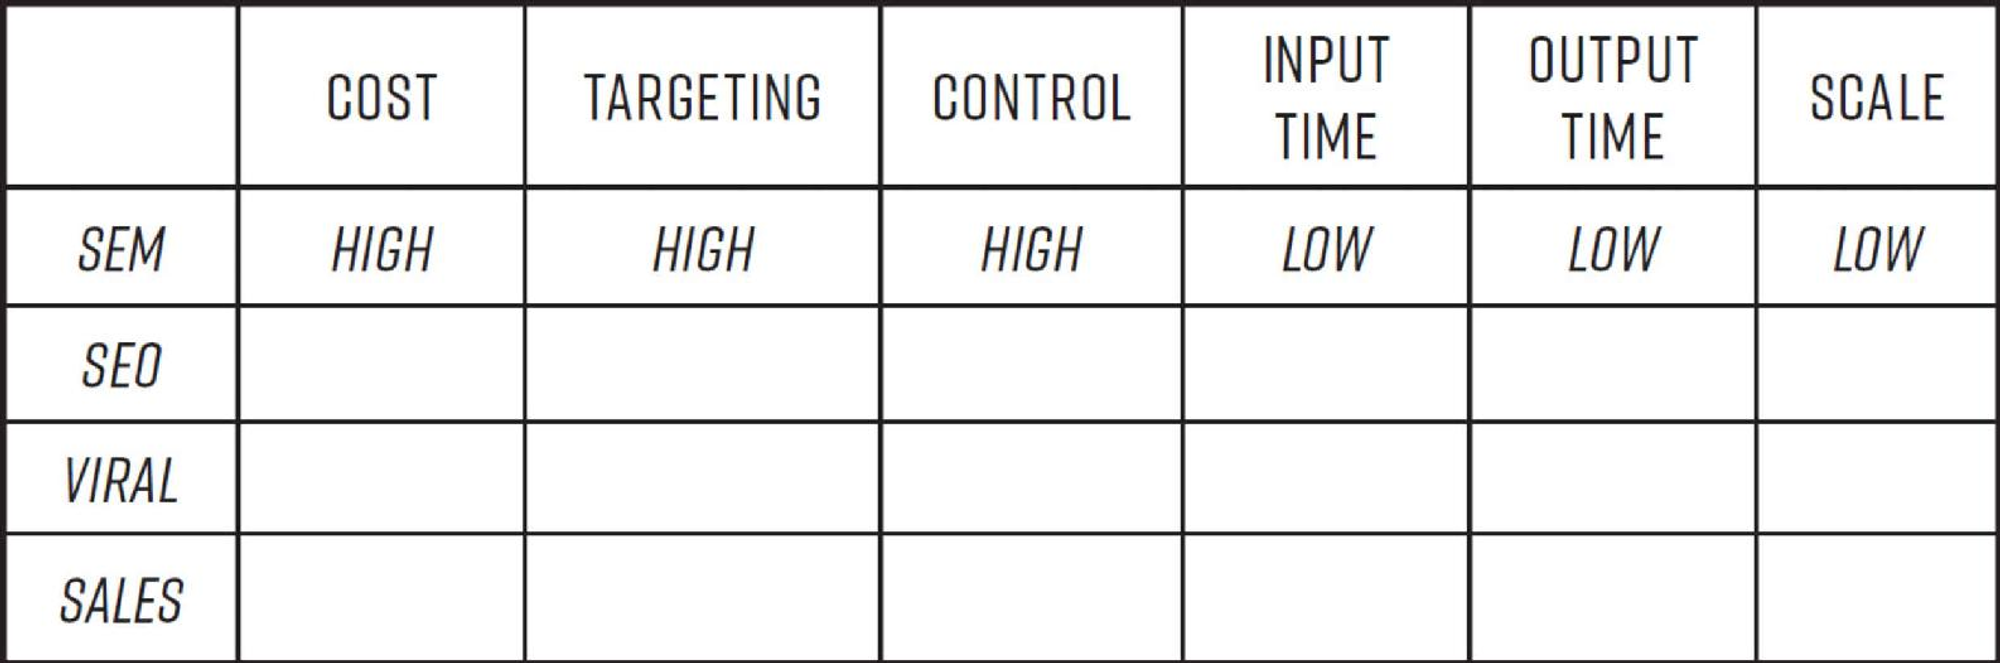
EXPERIMENTING TO GET CHANNEL/PRODUCT FIT
- Cost—how much you expect to have to spend to run the experiment in question.
- Targeting—how easy it is to reach your intended audience and how specific you can be in whom your experiment reaches.
- Control—how much control you have over the experiment. Can you make changes to the experiment once it’s live? Can you stop it easily or adjust it if it’s not going well?
- Input time—how much time it will take the team to launch the experiment. Filming a television ad, for example, has a much longer input time than setting up a Facebook ad.
- Output time—how long it will take to get results out of the experiment once it’s live. For example, search engine optimization experiments or social media may have longer output times than a radio ad does.
- Scale—how large an audience can you reach with the experiment? Television has a much larger scale than advertising on topical blogs.
PRIORITIZING DISTRIBUTION CHANNELS
- We score each channel the growth team proposes for testing on a scale of 1 to 10, with 10 being the best possible score and 1 being the least favorable score (note that lower cost, input, and output time will receive higher, not lower, numbers, since low cost and input and output times are obviously more favorable).